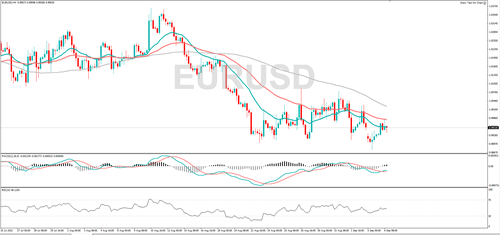
EUR/USD fell to a new 20-year low yesterday, but momentum has turned positive, suggesting the bulls are in control. If the wider downtrend continues, it might target 0.9906 or 0.9877. If the short-term rebound continues, it might hit 0.9985 or 1.0000.
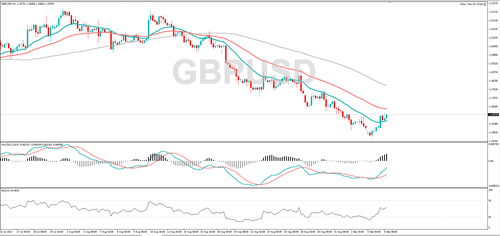
Yesterday, GBP/USD fell to its lowest level since March 2020. If the long-term bearish trend continues it might fall to 1.1510 or 1.1442. The MACD indicator shows that positive momentum is rising, implying the buyers are in control. 1.1652 or 1.1759 might act as resistance.
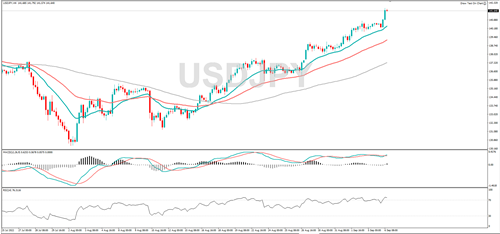
USD/JPY jumped to a 24-year high, and momentum is positive, suggesting the bulls are dominating. If the rally continues, it might target 142.00 or 143.00. The RSI is overbought, and that could be a sign the rally is overstretched, a pullback from here could see it hit 140.84 or 140.24.
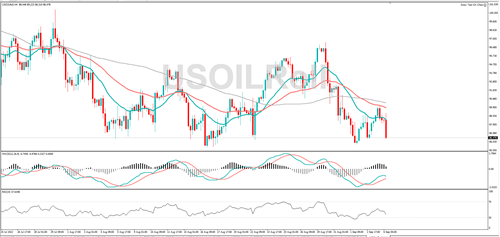
WTI is trending lower, RSI is falling, and positive momentum is dropping, this all speaks to bearish sentiment. A fall from here could see it target 85.74 or 85.37. A snapback might target 87.52 or 89.22.
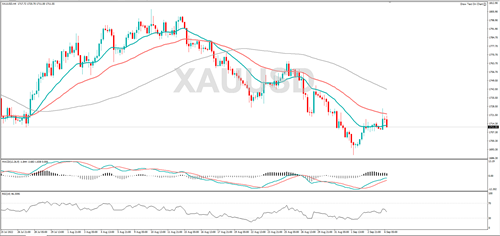
Gold’s longer-term trend is lower and positive momentum is fading, suggesting the bulls are losing influence. If the bearish trend continues, it might find support at 1709 or 1700. The near-term trend is higher, and a rally from here could see it hit 1726 or 1732.
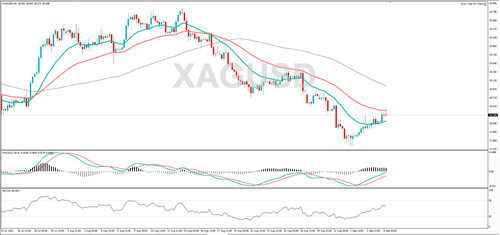
Silver is recovering, and momentum is in positive territory, which suggests the buyers are dominating. If the rally continues, it might target 18.53 or 18.83. Should the wider bearish trend resume, 18.12 or 18.00 might act as support.
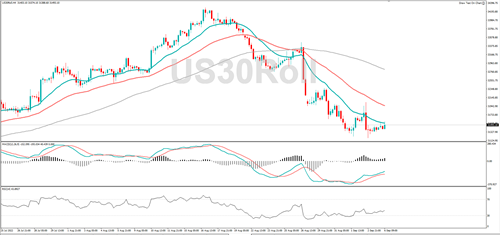
The Dow Jones is in a downtrend, and if the bearish move continues it might target 31329 or 31278. In the past two sessions, the Dow Jones has rebound. RSI is moving higher suggesting the price bias is to the upside. Resistance might be encountered at 31574 or 31680.